Calculate the volume of the Greenland ice sheet
The Processing Toolbox in QGIS provides a collection of tools and pre-written algorithms that allow the user to perform a wide variety of raster and vector data analyses. See the QGIS manual for complete documentation on the Processing Toolbox.
In this tutorial, the user will utilize the Processing Toolbox with data in QGreenland to calculate the Greenland ice sheet’s volume. In doing so, the user will become familiar with the how to use the Processing Toolbox to perform geospatial analysis.
Warning
This tutorial assumes the user has a basic understanding of GIS and geospatial data models (e.g., the difference between raster and vector data). If one if new to GIS, it is reccomended to review QGIS’ Gentle Introduction to GIS first
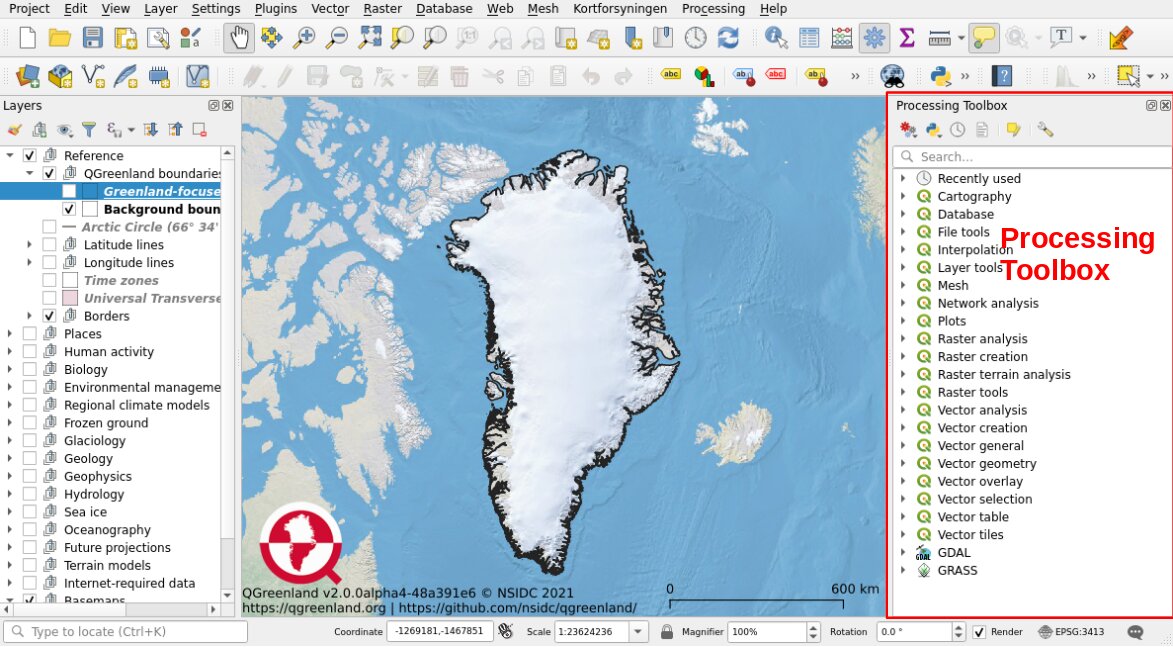
Open the Processing Toolbox
The Processing Toolbox can be opened from the menu bar by selecting View -> Panels -> Processing Toolbox. This will open a new panel with a variety of processing tools organized into groups.
Note
The Processing Toolbox can also be opened by clicking on the gear
![]() icon in the Attributes
Toolbar
icon in the Attributes
Toolbar  .
.
Use the Raster Surface Volume tool
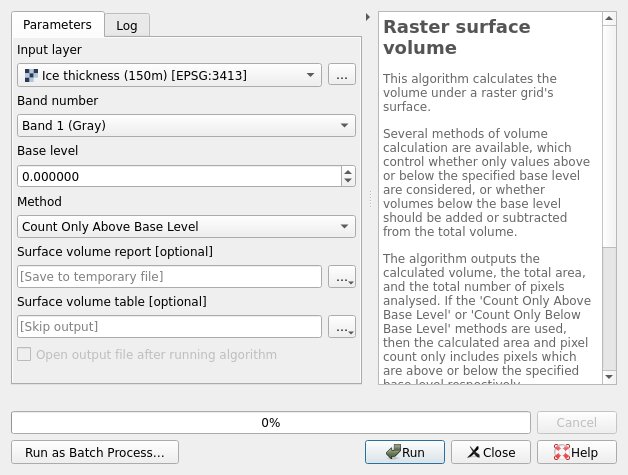
In the Processing Toolbox, go to Raster analysis -> Raster surface volume. This is an algorithm that calculates the volume under a raster grid’s surface. Double-click Raster surface volume to open the tool’s window, and enter the following parameters:
Input layer = Ice thickness (150 m)
There will only be one option for Band number
Base level = should already be set to 0. This is the minimum pixel value in the Ice thickness layer.
Method = Count only above base level (since we are interested in ice thickness values greater than zero)
Save the Surface volume report, the output for this algorithm, in a temporary file or in a desired location on one’s computer.
Click Run and wait for the analysis to finish. The window will switch to the Log tab, which shows log messages and results for the run. A Results Viewer panel should open in a panel underneath the Processing Toolbox. Close the Raster surface volume tool’s window and click on the “Surface volume report” entry in the Results Viewer. This will show a link to a results HTML page that can be opened in your broswer. Open this file and review the results.
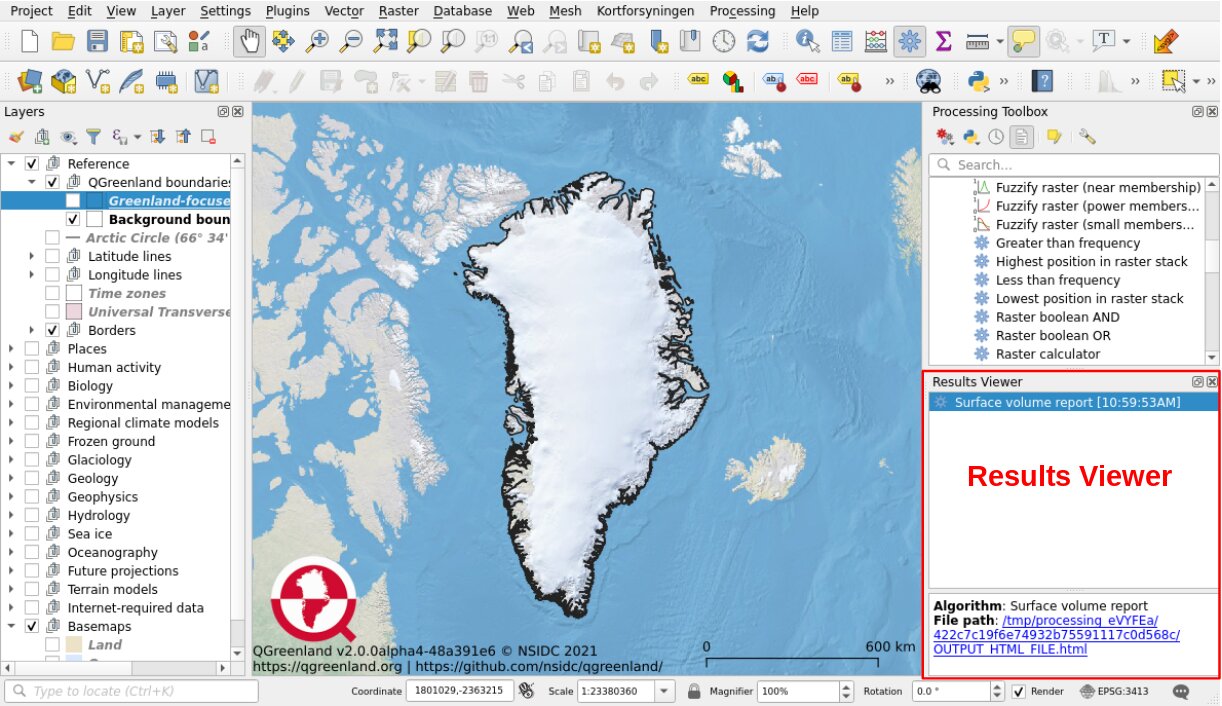
The results file will contain information from the run, including which file was analyzed, the calculated volume, pixel count, and total area. If one has succuessfully run the analysis, the results should show that the Greenland ice sheet has a volume of 2,965,561,810,382,715 m3, or about 3 million km3.
Summary
In completing this tutorial, the user has become familar with the Processing Toolbox and has successfully utilized the Raster Surface Volume tool with ice sheet thickness data included in the QGreenland core package to calculate the volume of the Greenland ice sheet. Having accomplished this, the user is now ready to explore other geospatial processing tools included in the Processing Toolbox to further analyze other QGreenland data.