Get started with QGreenland Core
By completing this tutorial, the user will install QGIS, download and open the QGreenland Core data package, become familiar with the QGIS interface, and browse some data included in QGreenland.
System Requirements
Before downloading the QGreenland Core data package, be sure that QGIS is installed on your computer: https://www.qgis.org/en/site/forusers/download.html. QGIS is available on Windows, macOS, Linux and Android.
As of this writing, the oldest version of QGIS we support for the QGreenland release series are:
QGreenland
1.x: QGIS3.16.x LTRQGreenland
2.x: QGIS3.16.x LTRQGreenland
3.x: QGIS3.28.x LTR
1) Download and Install QGIS
Go to qgis.org and download the free QGIS software, available on Windows, macOS, Linux and Android. It is recommended to download the long term release (3.16 or later) version.
2) Download and open the QGreenland Core package
Download the QGreenland Core data package (v3.0.0) at https://qgreenland.org/download.
Save the zip package to a location of your choice and unzip it.
Warning
Ensure QGreenland is actually unzipped; some operating systems will only
“explore” a zip file when you double-click it without actually extracting it to disk.
In Windows, please right-click and select Extract all....
Open the qgreenland.qgz file in the data package folder by double-clicking
it. QGIS will open automatically and display the QGreenland Core data
environment.
Note
Depending on your version of QGreenland Core, the package may be a .qgs or a
.qgz file. They should function the same as long as you have a compatible
version of QGIS.
Note
If QGIS is already open, one can open the qgreenland.qgz project file
within QGIS by navigating to the Project -> Open… option in the menu bar and
selecting the qgreenland.qgz file from its saved location.
3) Get to know the QGIS Interface
In this user guide you will see various screenshots of the QGreenland Core and QGIS interface. The screenshots in this guide were generated from QGIS version 3.16 running on a macOS Catalina operating system; thus, depending on the operating system and QGIS version you are using, your QGIS interface may look slightly different.
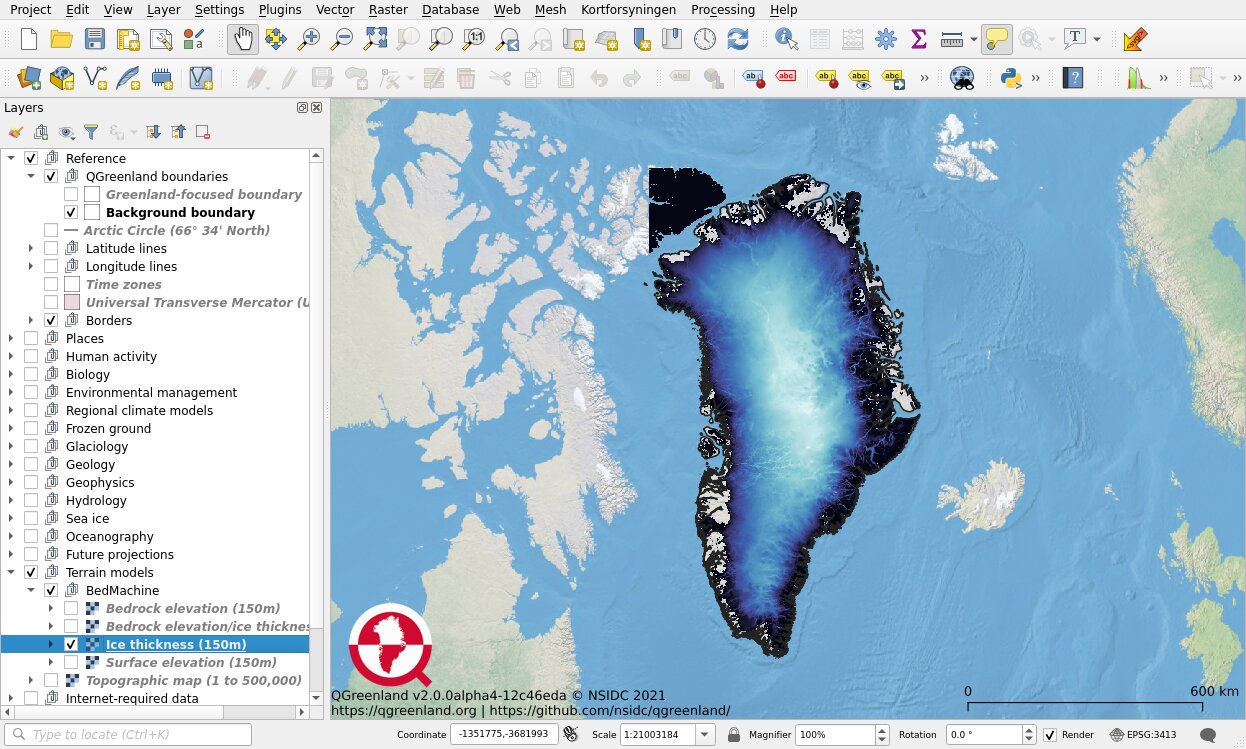
The main components of the QGIS interface are the Map view, Status bar, Layers panel, Toolbars, and the Menu bar.
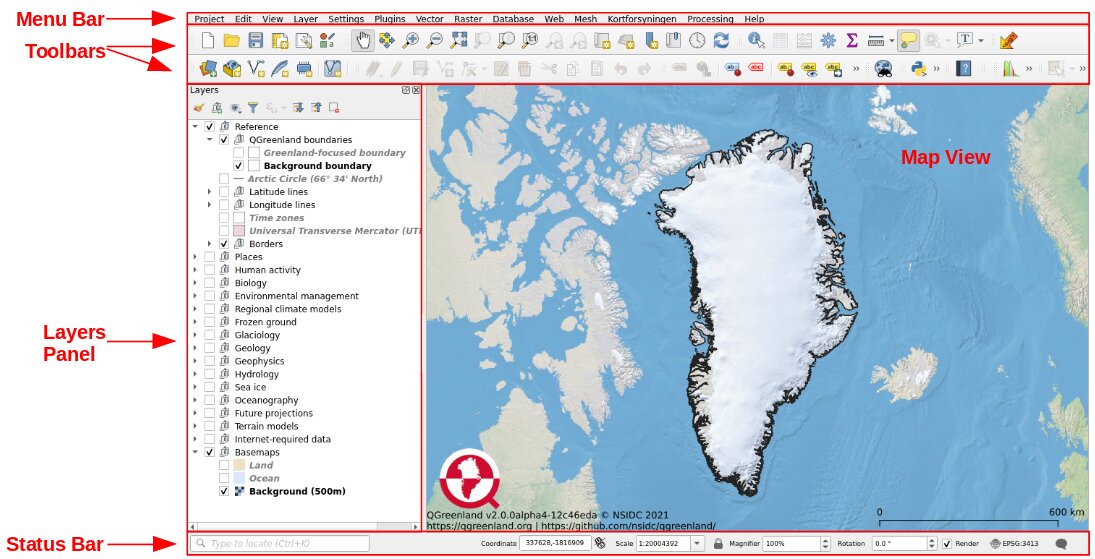
Fig. 1 Main components of the QGIS/QGreenland interface.
The Map View is the main part of the QGIS/QGreenland Core interface where the data layers are displayed. A GIS ‘layer’ refers to a geospatial dataset along with the symbols and labels used to portray it in a GIS environment.
The Status bar is the bar at the bottom of the QGIS window that shows the current coordinate reference system of the Map View, any available plugin updates, and the Map view scale. Also included in the Status bar is a quick search bar and a button to open a Log Messages window to view log messages.
The Layers Panel is where all data layers in the current project are listed. Layers can be toggled on or off, which will control whether or not they show up in the Map View. Layers are listed in the order in which they show up in the Map View - layers at the top of the list show up on top in the Map View, and vice versa. Layers can be manually moved around in the Layers Panel to change the order in which they show up. Panels and Toolbars can also be manually moved around the QGIS interface to fit the user’s preferences.
When you first open the QGreenland Core data package, two reference layers will be automatically toggled on: Greenland coastlines 2017 and the QGreenland Basemap. Layers can be rearranged by clicking and dragging up or down. Layer groups can be expanded or collapsed by clicking on the arrow to the left of the checkbox. To expand or collapse all layers at once, click on the respective buttons (Fig. 2 (a)) right above the layers list in the Layers Panel. In addition to the Layers Panel, there are a variety of other panels that can be displayed on the QGIS interface. For example, the Browser Panel provides a shortcut for accessing other data layers or project files on your computer or another location. Panels can be moved around the interface by clicking and dragging, and can be removed by clicking on the ‘X’ box in the upper righthand corner.
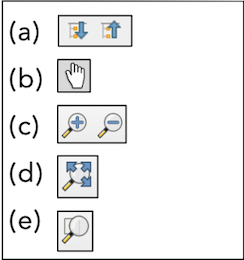
Fig. 2 (a) Expand All and Collapse All buttons at the top of the Layers Panel to expand or collapse layers; (b) Pan Map button in the Map Navigation Toolbar to grab and drag the map view; (c) Zoom In and Zoom Out buttons in the Map Navigation Toolbar to zoom in or out in map view; (d) Zoom Full button in the Map Navigation Toolbar to bring all visible layers into the Map View; (d) Zoom to Layer button in the Map Navigation Toolbar to bring a desired layer into view.
The Toolbars contain buttons that allow the user to interact with the Map View. For example, the Pan Map button (Fig. 2 (b)) in the Map Navigation Toolbar lets the user grab and drag the map view around. The magnifying glass buttons (Fig. 2 (c)) allow the user to zoom in and out or to a particular feature or selection in the map view. More information about a toolbar button’s function can be obtained by hovering one’s mouse over the button. Toolbars can be moved around the QGIS workspace by clicking and dragging. To toggle a toolbar on or off, simple right click on a toolbar and check or uncheck the desired boxes (Fig. 3).
If data layers are toggled on but not visible in the map view, the magnifying glass with three arrows (Zoom Full) button (Fig. 2 (d)) will bring all visible layers back into the map view. Right clicking on a layer in the Layers Panel and selecting Zoom to Layer or clicking on the magnifying glass over a square button (Fig. 2 (e)) in the Map Navigation Toolbar will also bring a desired layer into view in the Map View.
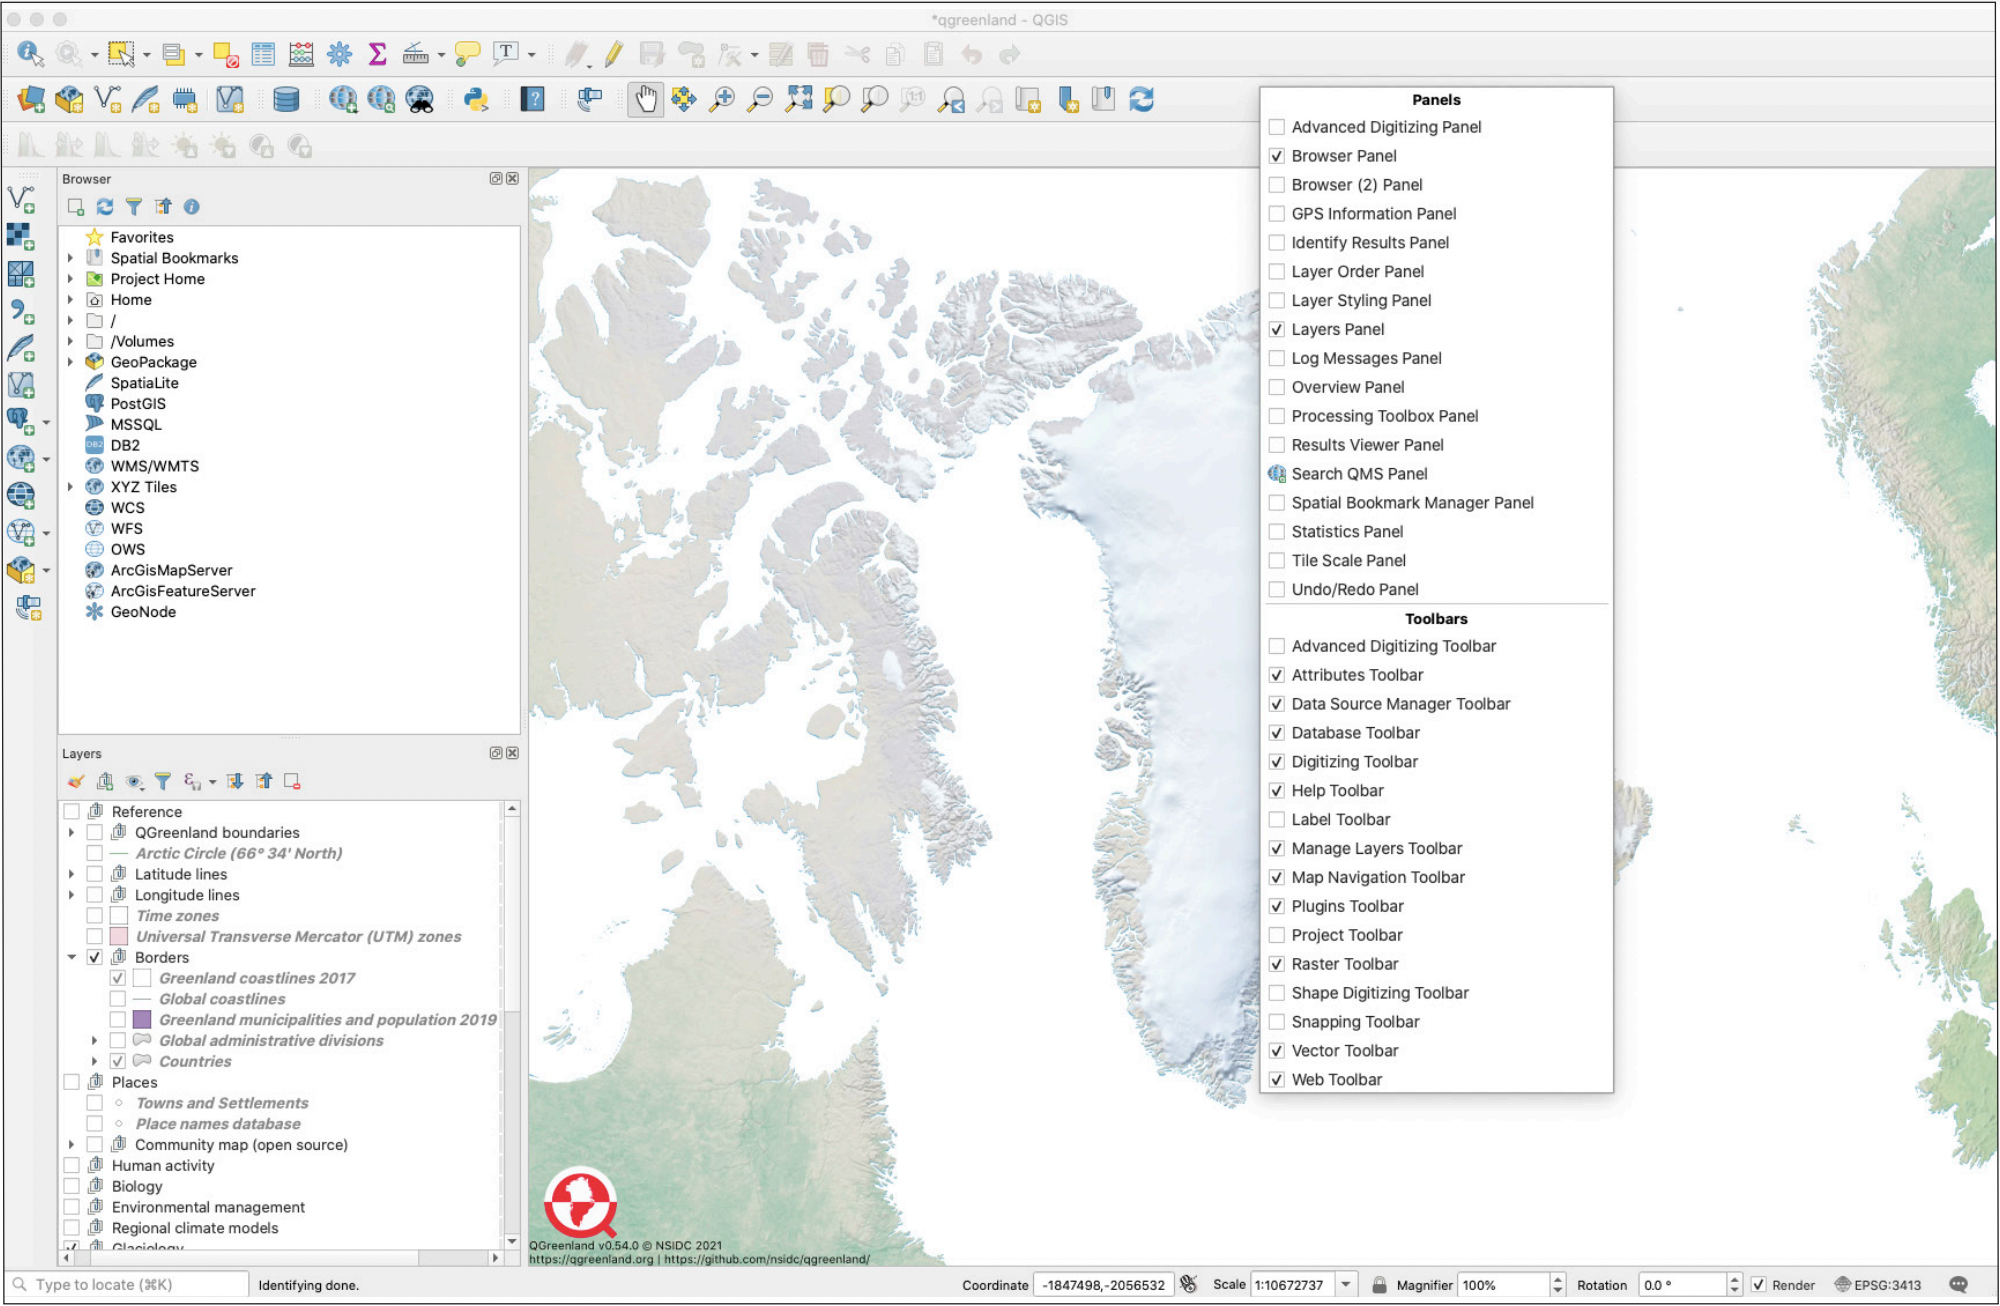
Fig. 3 Toolbars can be added or removed by right clicking on the toolbar area and checking/unchecking boxes.
Lastly, the Menu bar and Toolbars are different ways to access most QGIS functions, such as opening or saving a project or analyzing the data using geoprocessing tools. Panels are another way for users to interact with data layers and functions in QGIS. You can fully customize the look and layout of your QGIS interface by going to ‘View’ in the menu bar and selecting the Panels, Toolbars, etc. that you would like visible.
Note
The QGIS User Manual provides a detailed and comprehensive overview of QGIS’ core features. Users who are new to Geographic Information Systems may also benefit from reviewing QGIS’s Gentle Introduction to GIS
4) Browse data in the QGreenland project
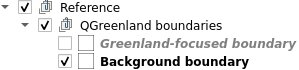
Layers in QGreenland Core are organized into groups by category. For example, the “Background boundary” layer is “QGreenland boundaries” group, which is itself inside of the “Reference” group (“Reference/QGreenland boundaries/Background boundary”).
Toggle layer visibility
Some layers are turned on by default when opening the QGreenland Core project. In order to visualize another data layer (or remove an existing one), toggle the checkbox next to the layer in the Layers panel.
Toggle on the “Ice thickness (150m)” layer, which is in the “Terrain models/Bedmachine v5” group. The Map view should now include a visualization of Ice thickness at a 150m spatial resolution.
Note
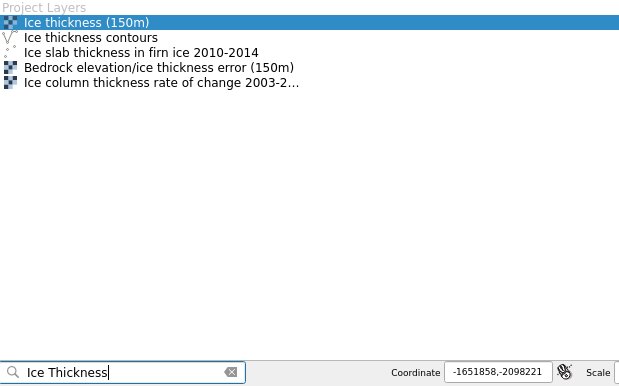
The search bar, located in the Status bar, can also be used to find layers
in the Layers panel.
Navigate the Map View
The Map view can be interacted with using a combination of the mouse and the Map Navigation Toolbar

By default, the Pan Map tool is selected
 . This tool allows the user to click and drag on
the map view to change the extent. Try using this tool to pan around the map and
explore the geography surrounding Greenland.
. This tool allows the user to click and drag on
the map view to change the extent. Try using this tool to pan around the map and
explore the geography surrounding Greenland.
The zoom tools ![]() can be used
to zoom in and out of the map view. Select the Zoom In tool and use it to
draw a box around southern Greenland to get a better look at the “Ice thickness
(150m)” layer in that part of Greenland. Now select the Pan Map tool again
and explore the layer in detail.
can be used
to zoom in and out of the map view. Select the Zoom In tool and use it to
draw a box around southern Greenland to get a better look at the “Ice thickness
(150m)” layer in that part of Greenland. Now select the Pan Map tool again
and explore the layer in detail.
Note
The scroll wheel on your mouse or track pad can also be used to zoom in and out in the Map view
Hovering over the other map navigation tool icons will provide a tool tip indicating what the tool is used for. Try hovering over some of the other icons in the Map Navigation Toolbar to read their tooltips. Try out some of these other tools to explore the map and QGreenland’s various data layers. See the QGIS documentation on zooming and panning for more detailed information on how to effectively navigate the Map View.
5) Summary
In completing this tutorial, the user has installed QGIS, downloaded and opened the QGreenland Core data package, and learned about the fundamentals of using QGIS to explore QGreenland. Having accomplished this, the user is prepared to explore the many data layers included with QGreenland Core. The user is now ready to approach more advanced topics such as performing geospatial analyses and preparing publication-quality maps with the data in QGreenland Core.